Augusta University

Measuring country-wise population replacement levels is a component of the measures in the United Nation’s millennium development goals, and the data that goes into computing this measure is also a component of the health aspect of Human Development Index.
In 2021, Augusta University’s Arni S.R. Srinivasa Rao, PhD, presented a critique on the formula of net population replacement levels at the International Population Conference 2021 in Hyderabad, India. It was one of the first times he had publicly shared his latest research on population replacement commonly calculated through net reproduction rate (NRR). A blog on the same topic written by him also appeared in Population Association of America’s PAA Affairs.
Rao, director at the Laboratory for Theory and Mathematical Modeling in the Division of Infectious Diseases at the Medical College of Georgia, has published extensive research around the United Nation’s Human Development Index, which is comprised of three measures of a nation: health, knowledge and standard of living. His HDI research also included pre-colonial HDI values for India and other colonial countries.
In the years since that presentation, Rao and co-author James R. Carey, professor and entomologist at the University of California, Davis, have worked to refine their proposed formula for population replacement using a new concept called partition theorem approach. Their article, “Stationary status of discrete and continuous age-structured population models,” was recently published in the scientific journal Mathematical Biosciences.
“The current model of NRR is not a bad formula; it just has never allowed for measurement of the status of population replacement immediately,” Rao said. “You have always had to wait years to calculate it properly and see if it was correct. This new formula we developed will allow that to happen in a more timely and accurate fashion.”
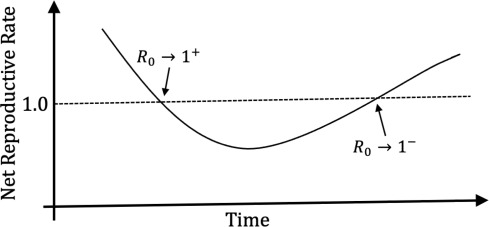
Population replacement level looks at how many women who are of reproductive age (15-45 years old) are producing female children during their reproductive lifetime.
For example, according to World Population Prospects 2022, the NRR value for Peru was estimated 1.047. Rao argues that does not actually mean the replacement population has occurred for Peru around 2022. Using his proposed population replacement for Peru, Rao has calculated that is still far from being attained.
“Our research questions the timeliness of the value of NRR in deciding the stationary process of the country. We proved associated theorems on discrete and continuous age distributions and were able to derive measurable functional properties,” Rao said. “As the population growth rates for an ever-increasing number of countries trend toward replacement levels and below, new demographic concepts and metrics are needed to better characterize this emerging global demography now, not later.”
Despite important annual exercises to understand the population replacement levels and stationary status of populations, Rao addresses several limitations in their approaches. He argues that a proper measure needs to be adopted by the UNDP that can compute the annual level of population replacement.
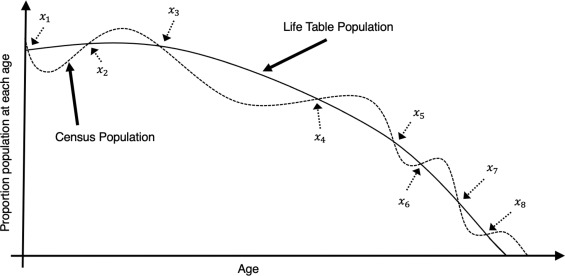
population. The values ?1, ?2,…, ?8 forms the stationary component set ?.
Due to the fact that NRR is inherently static, Rao said more study is needed to properly identify the criteria required for specifying population stationarity than are currently used. He also notes that populations are inherently dynamic due to the ever-changing age structure and trajectories of birth and death rates. Conducting repeated comparisons of the age structure through partition theorem-based studies over several decades will shed important, timely light on the dynamic component of stationarity in a country.
In his work, Rao was able to show just how intuitive his theorem was through real-world analytics, adding, “This theorem brings an innovative implication of the partition theorem to light. Such implications and interpretations of population stationarity were not seen earlier.”
Rao noted that constructing sets based around populations and representing them as a collected union of various sets based on a specific set of properties makes it easier and presents a more holistic approach in handling population data sets.
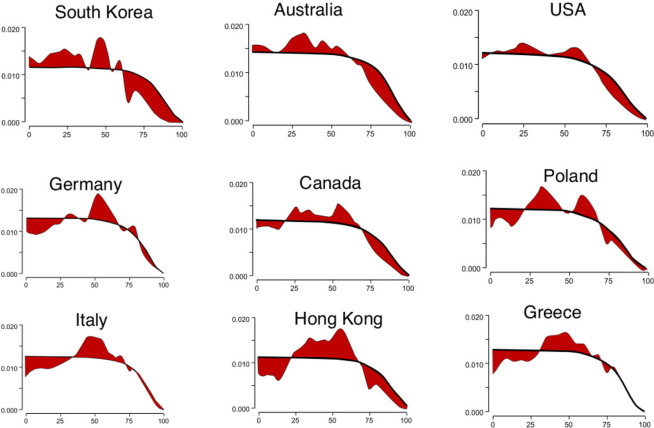
In his research, Rao was able to provide country-specific analysis for a carefully curated selection of countries based around the newly proposed measures. He does note that traditional approaches based on survival analysis or life tables are applicable for shorter-time projections, and his proposed formula provides population replacement levels in a given year based on the data available around that year.
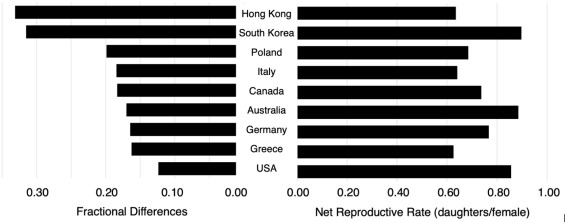
of actual population and corresponding NRR values.
Earlier, Rao developed the first AI model for the identification of COVID-19 through apps. His recent work involves partition theorem in populations, chicken-walk models, Rao’s Partition Theorem in Populations and Rao-Carey Fundamental Theorem in stationary populations, multilevel contours and bundles of complex planes.
“Our article not only adds to the recent developments in stationary population models, but also brings fresh thoughts on the interpretation of stationary populations and more meaningful population analysis involving both stationary and non-stationary populations.”